Exoplanet Validation
using Machine Learning
Jevgenij Gamper
Supervised by: David Armstrong, Theo Damoulas
MSc Mathematics of Systems project presentation 27/09/2017
Kepler Mission
- 4.5 million stars under the observation field
- 150 thousand Kepler Objects of Interest (KOI)
- Planetary signal is classified into
- False Positive
- Candidate
- Confirmed
- False Positive
Kepler Mission Science pipeline refer to Jenkins et al. (2010). Kepler mission achievements and contributions to astro. community refer to Batalha (2010).
Problem
When searching for new planets through transit detection in NASA's Kepler satelite data, a significant portion of time is spent on validation of the detected signal via:
- Slow Monte-Carlo validation methods
- Blender (Torres et al. 2010)
- Vespa (Morton & Johnson 2011)
- Pastis (Diaz et al. 2014)
- Time consuimg follow-up observations
In this work:
- Optimise and test ML methods in classying planetary signal into False Positive or Confrimed
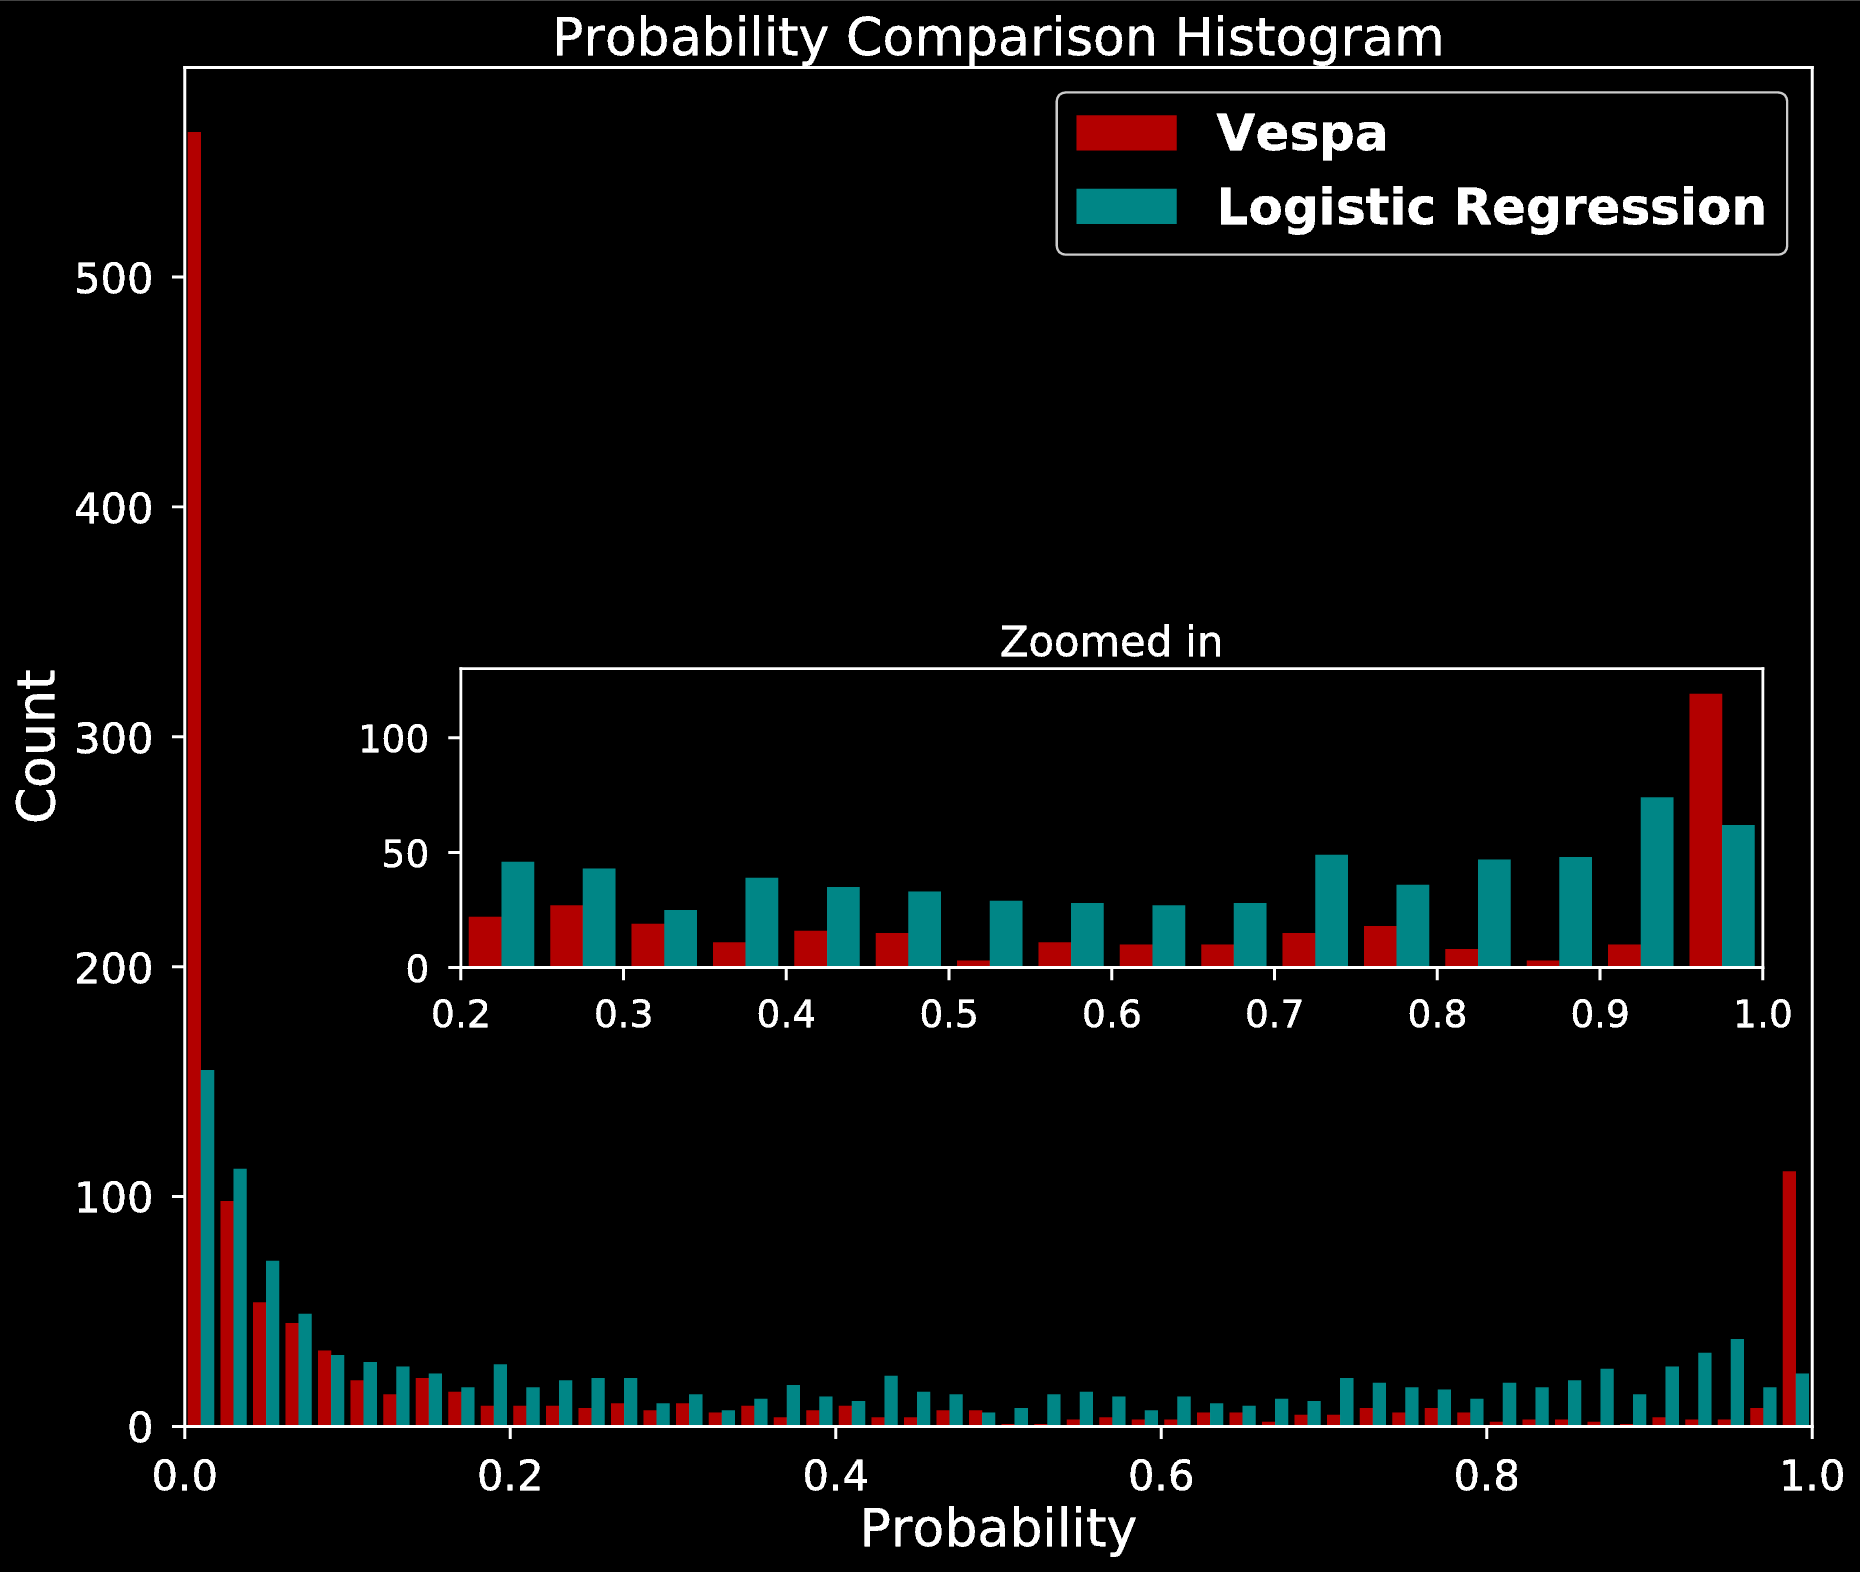
- Evaluate the quality of predicted False Positive probabilities and compare to existing validation methods
- Vespa (Morton & Johnson 2011)
Pre-trained models would allow to:
- Quickly validate planets, and only focus on uncertain signals
- Save on follow up observation resources
Preprocessing & Data
We follow procedures in McCauliff et al. (2014) and use:
- Thershold Crossing Events (TCE) catalog
- 34,024 detected TCEs
- KOI catalog (Burke et al. 2014)
- Known, already validated planets
Matching two catalogs gives us 4049 instances for training:
- 2238 Confirmed planets
- 1810 False Positives
- 1189 unlabeled signals
- 139 features per instance
Two additional statistics computed:
- Maximum ephemeris correlation (McCauliff et al. 2014)
- Self Organising Map statistic (Armstrong et al. 2016)
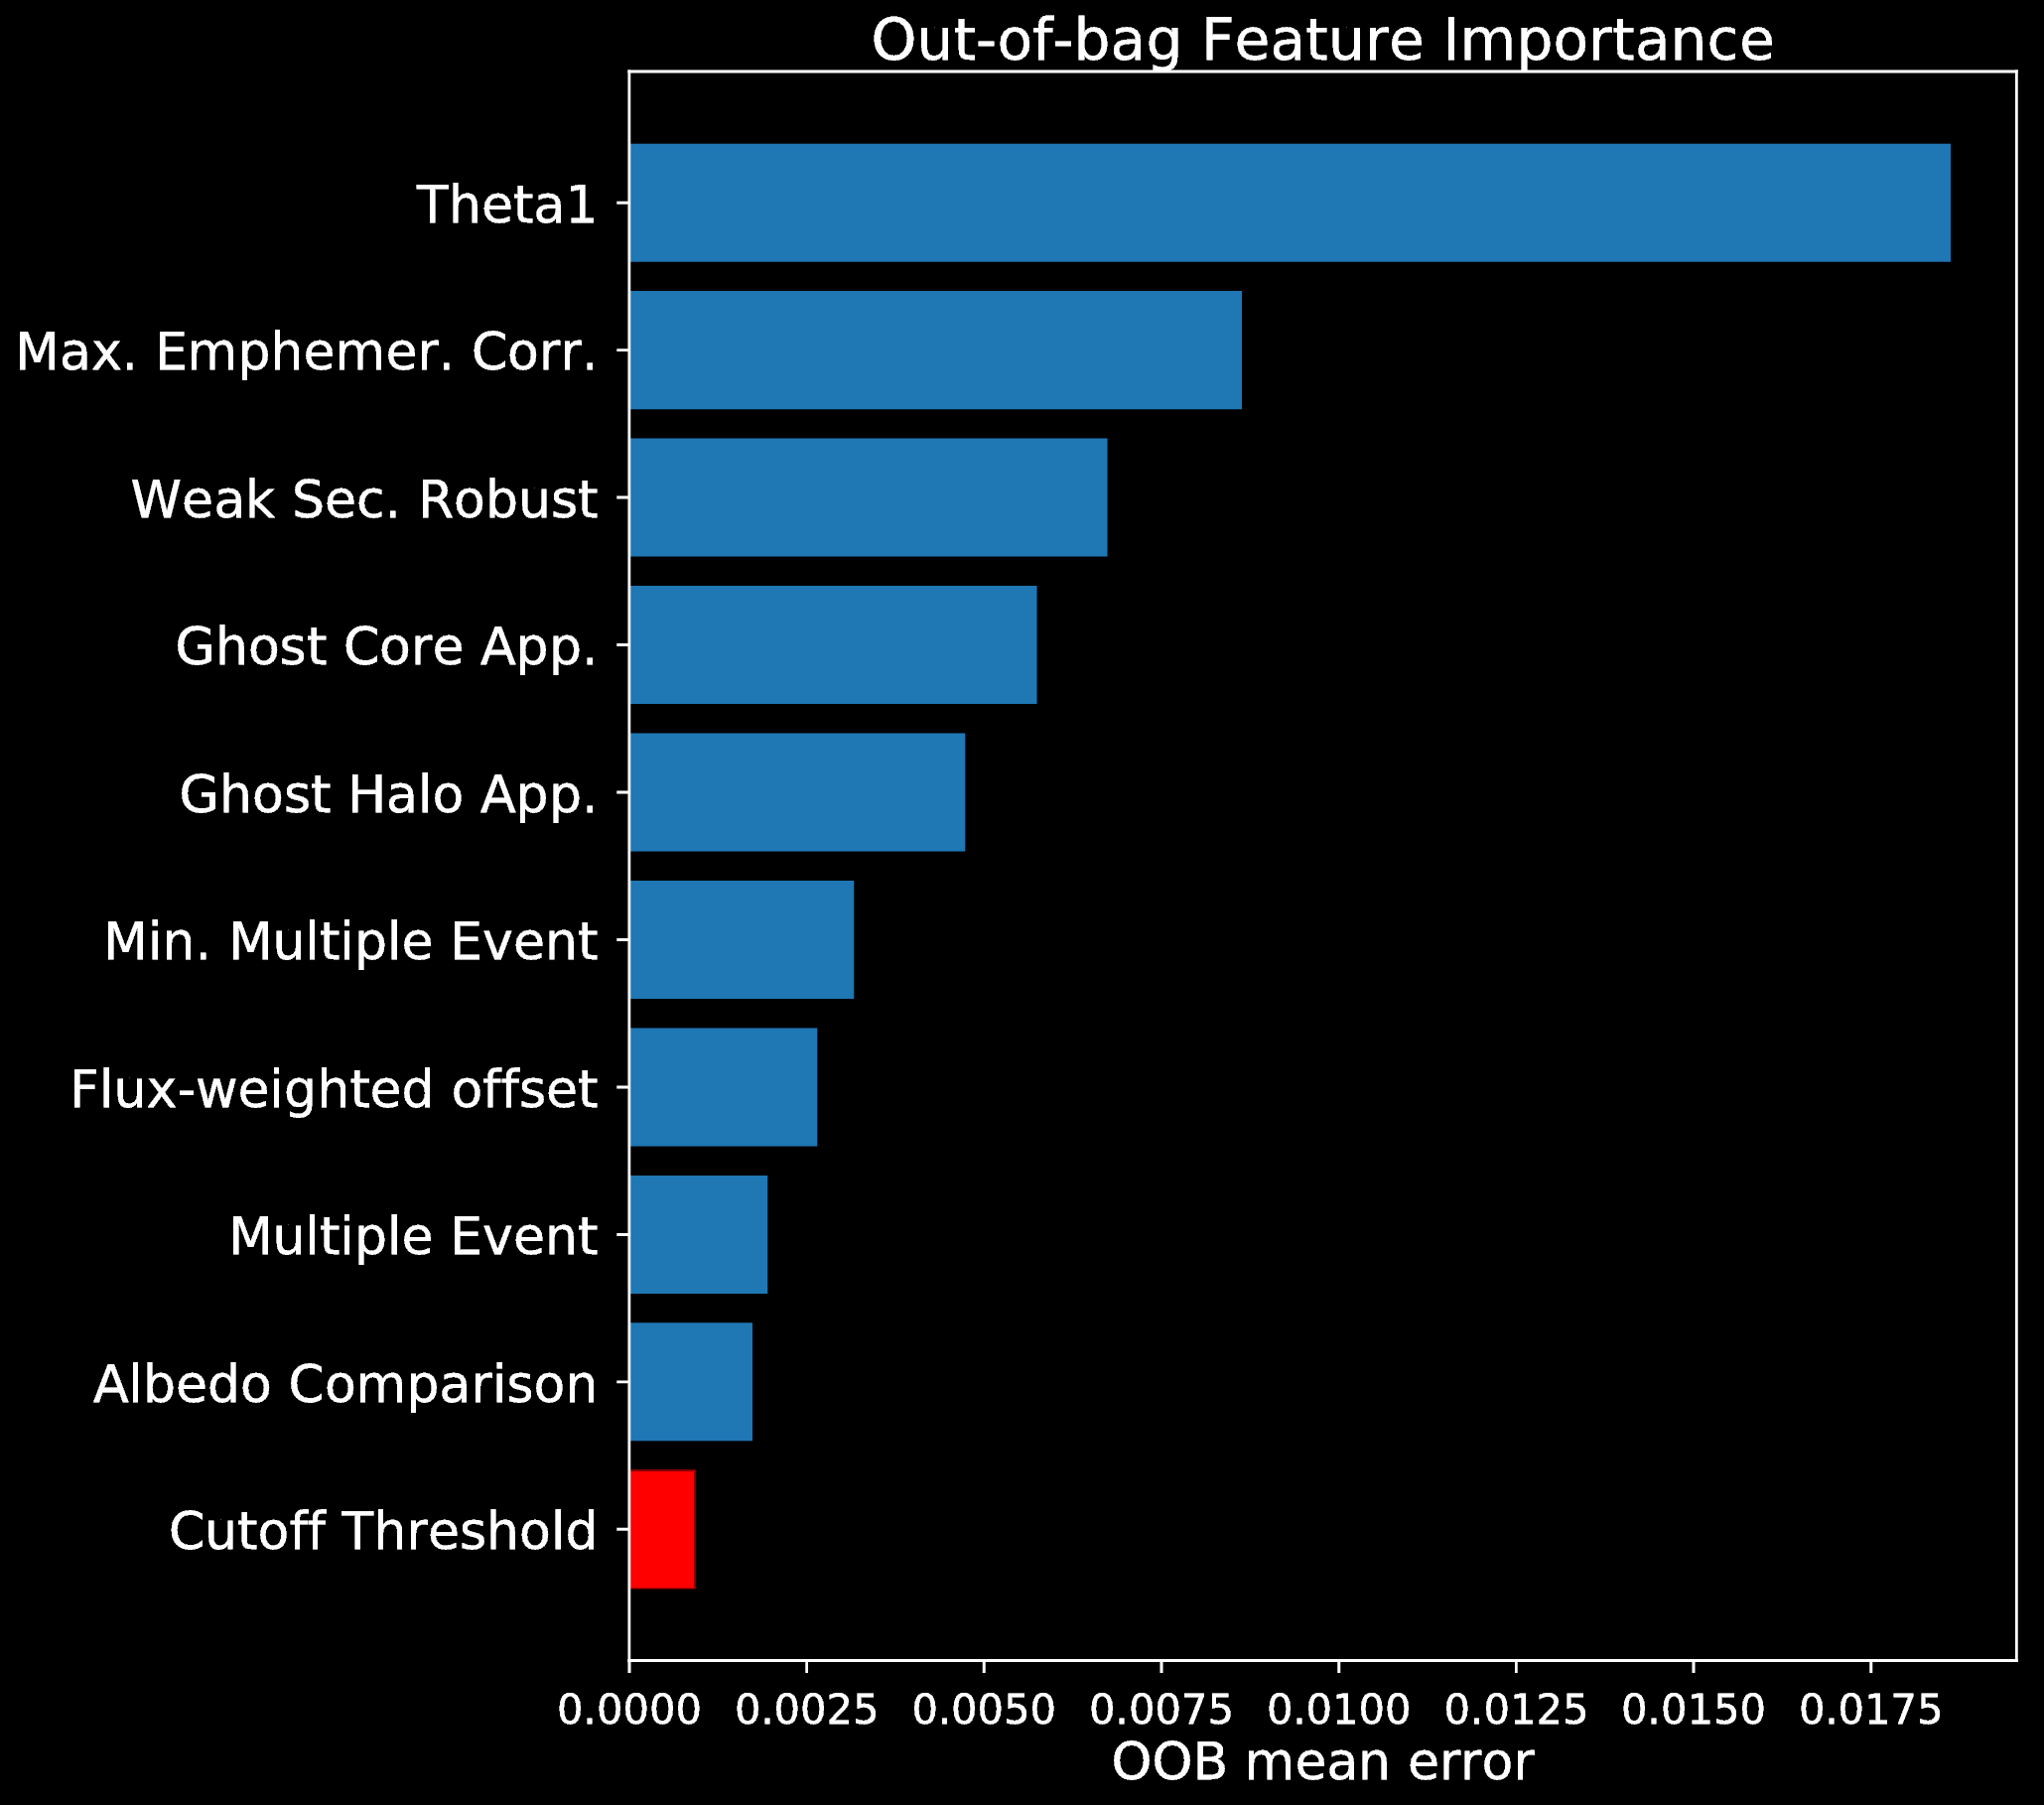
Feature Importance
Feature Importance (following McCauliff et al. 2014):
- Fit Random Forest model
- Permute an attribute within out-of-bag data of the tree
- Predict and compute the error
Mean increase in error is the importance of the permuted feature
Correlation
- Compute Pearson's correlation between each attribute
- If correlation above threshold, remove least important attribute
Methods and Results
| Model | No. of param. comb. |
|---|---|
| Random Forest | 4 |
| Extra Trees | 16 |
| Decision Tree | 3 |
| K-NN | 24 |
| SVM | 6 |
| Neural Network | 327 |
| Logistic Regression | 2 |
| LDA | 1 |
| QDA | 1 |
| GP | 1 |
| Model | AUC | Precision | Recall | Brier |
|---|---|---|---|---|
| Random Forest | 0.99 | 0.96 | 0.94 | 0.03 |
| Extra Trees | 0.99 | 0.97 | 0.94 | 0.04 |
| Gaussian Process | 0.98 | 0.92 | 0.90 | 0.04 |
| Logistic Regression | 0.97 | 0.92 | 0.90 | 0.06 |
| LDA | 0.97 | 0.92 | 0.87 | 0.07 |
| Ridge Classifier | 0.97 | 0.92 | 0.87 | 0.10 |
| SVM | 0.97 | 0.92 | 0.90 | 0.17 |
| K-NN | 0.96 | 0.98 | 0.89 | 0.07 |
| Neural Network | 0.96 | 0.92 | 0.89 | 0.07 |
| QDA | 0.95 | 0.96 | 0.57 | 0.20 |
| Decision Tree | 0.92 | 0.95 | 0.93 | 0.06 |
- Simple decision boundaries are sufficient
- Decision Tree ensembles are "to good" for us
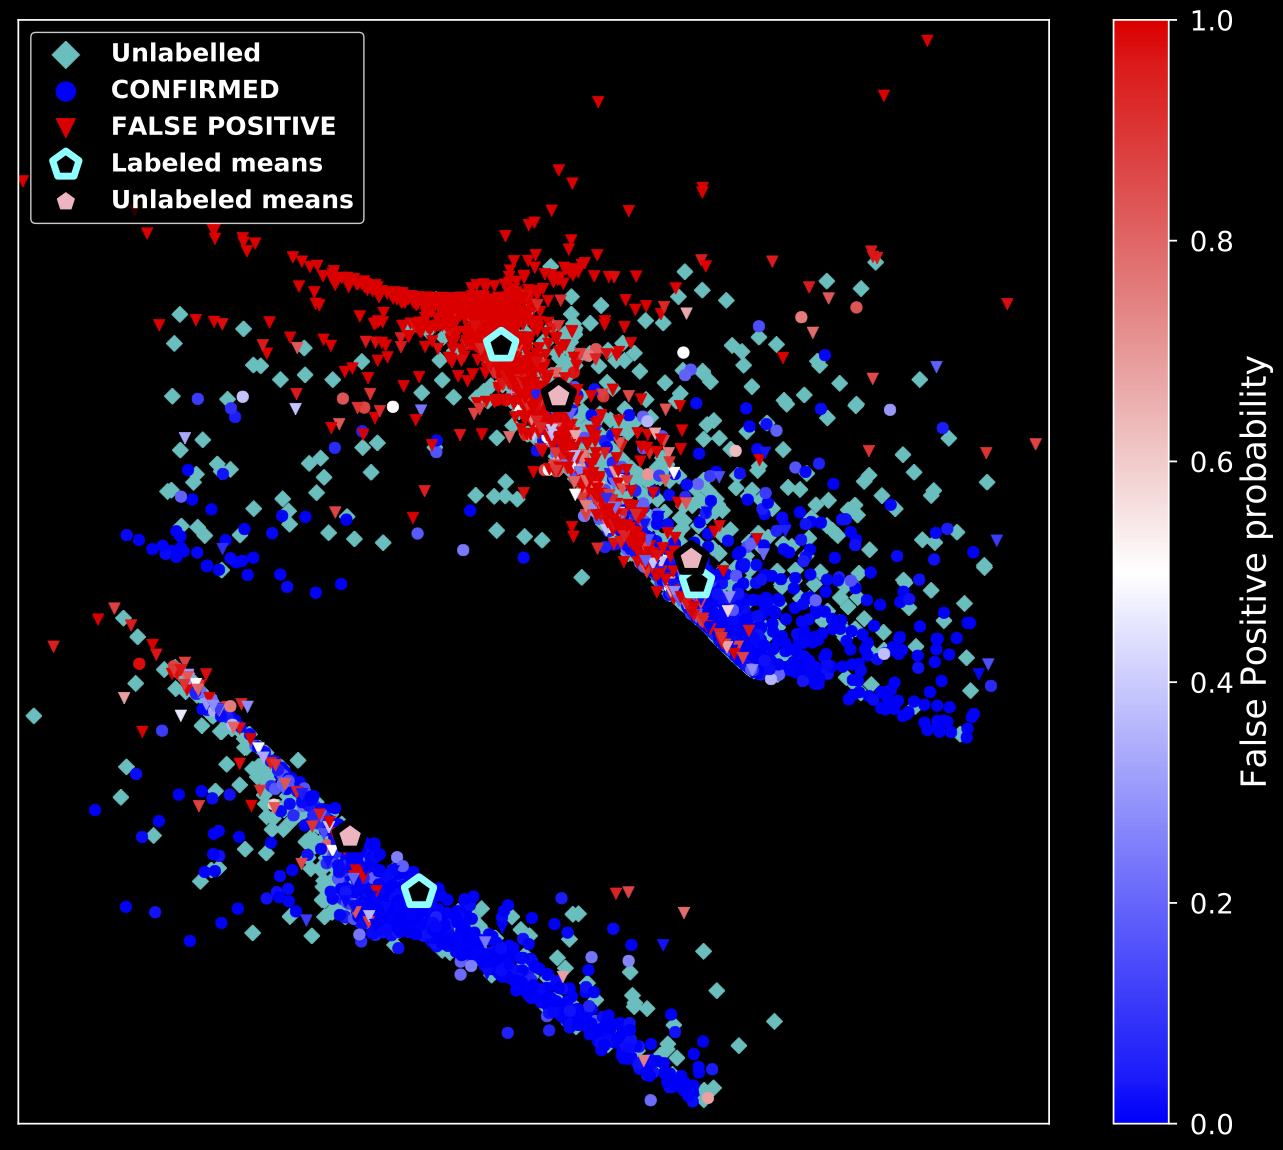
- Investigate the normality of each point using properties of Random Forests (Liu et al. 2008)
For each instance $i$, compute normality score $N_i$
$$N_i = 2^{\frac{\mathbf{E}(D_i)}{\mathbf{E}(P_i)}}$$
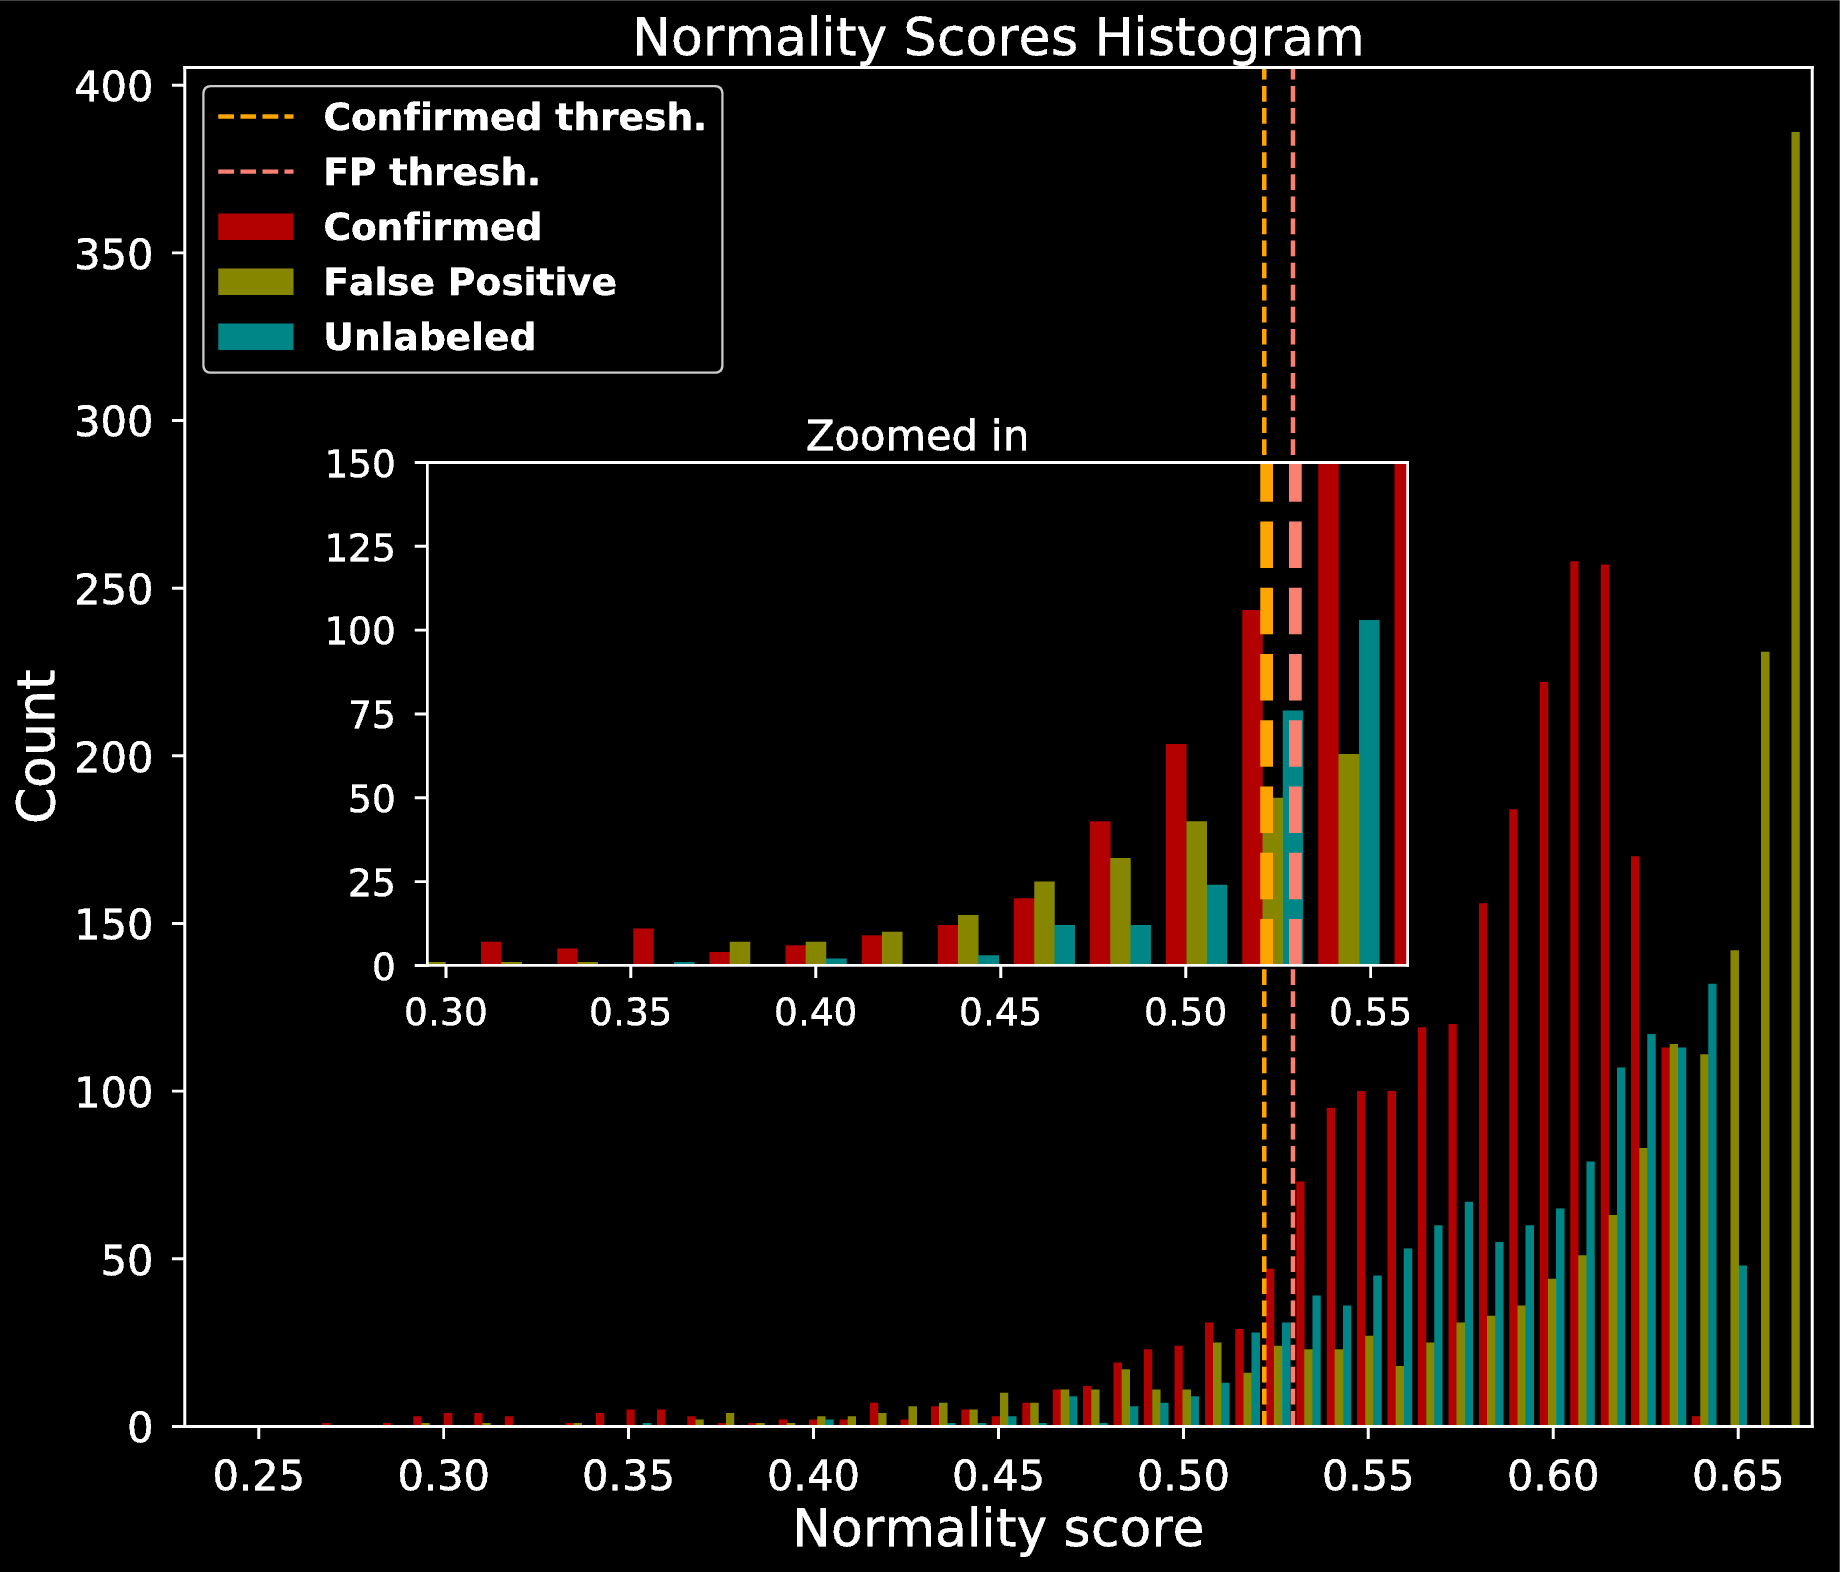
| Model | Avg. Abs. Diff. | Skew of Abs. Diff. | ||||
|---|---|---|---|---|---|---|
| Lab. | Unlab. | Lab. | FP | Conf | Unlab. | |
| Random Forest | 0.14 | 0.26 | 2.08 | 1.15 | 3.66 | 1.01 |
| Logistic Regression | 0.15 | 0.31 | 2.02 | 1.15 | 3.33 | 0.73 |
| LDA | 0.15 | 0.31 | 1.76 | 1.32 | 2.73 | 0.75 |
| Gaussian Process | 0.16 | 0.29 | 1.76 | 1.21 | 2.48 | 0.79 |
Summary
- Built 9 dimensional representation for each TCE
- Tested classification
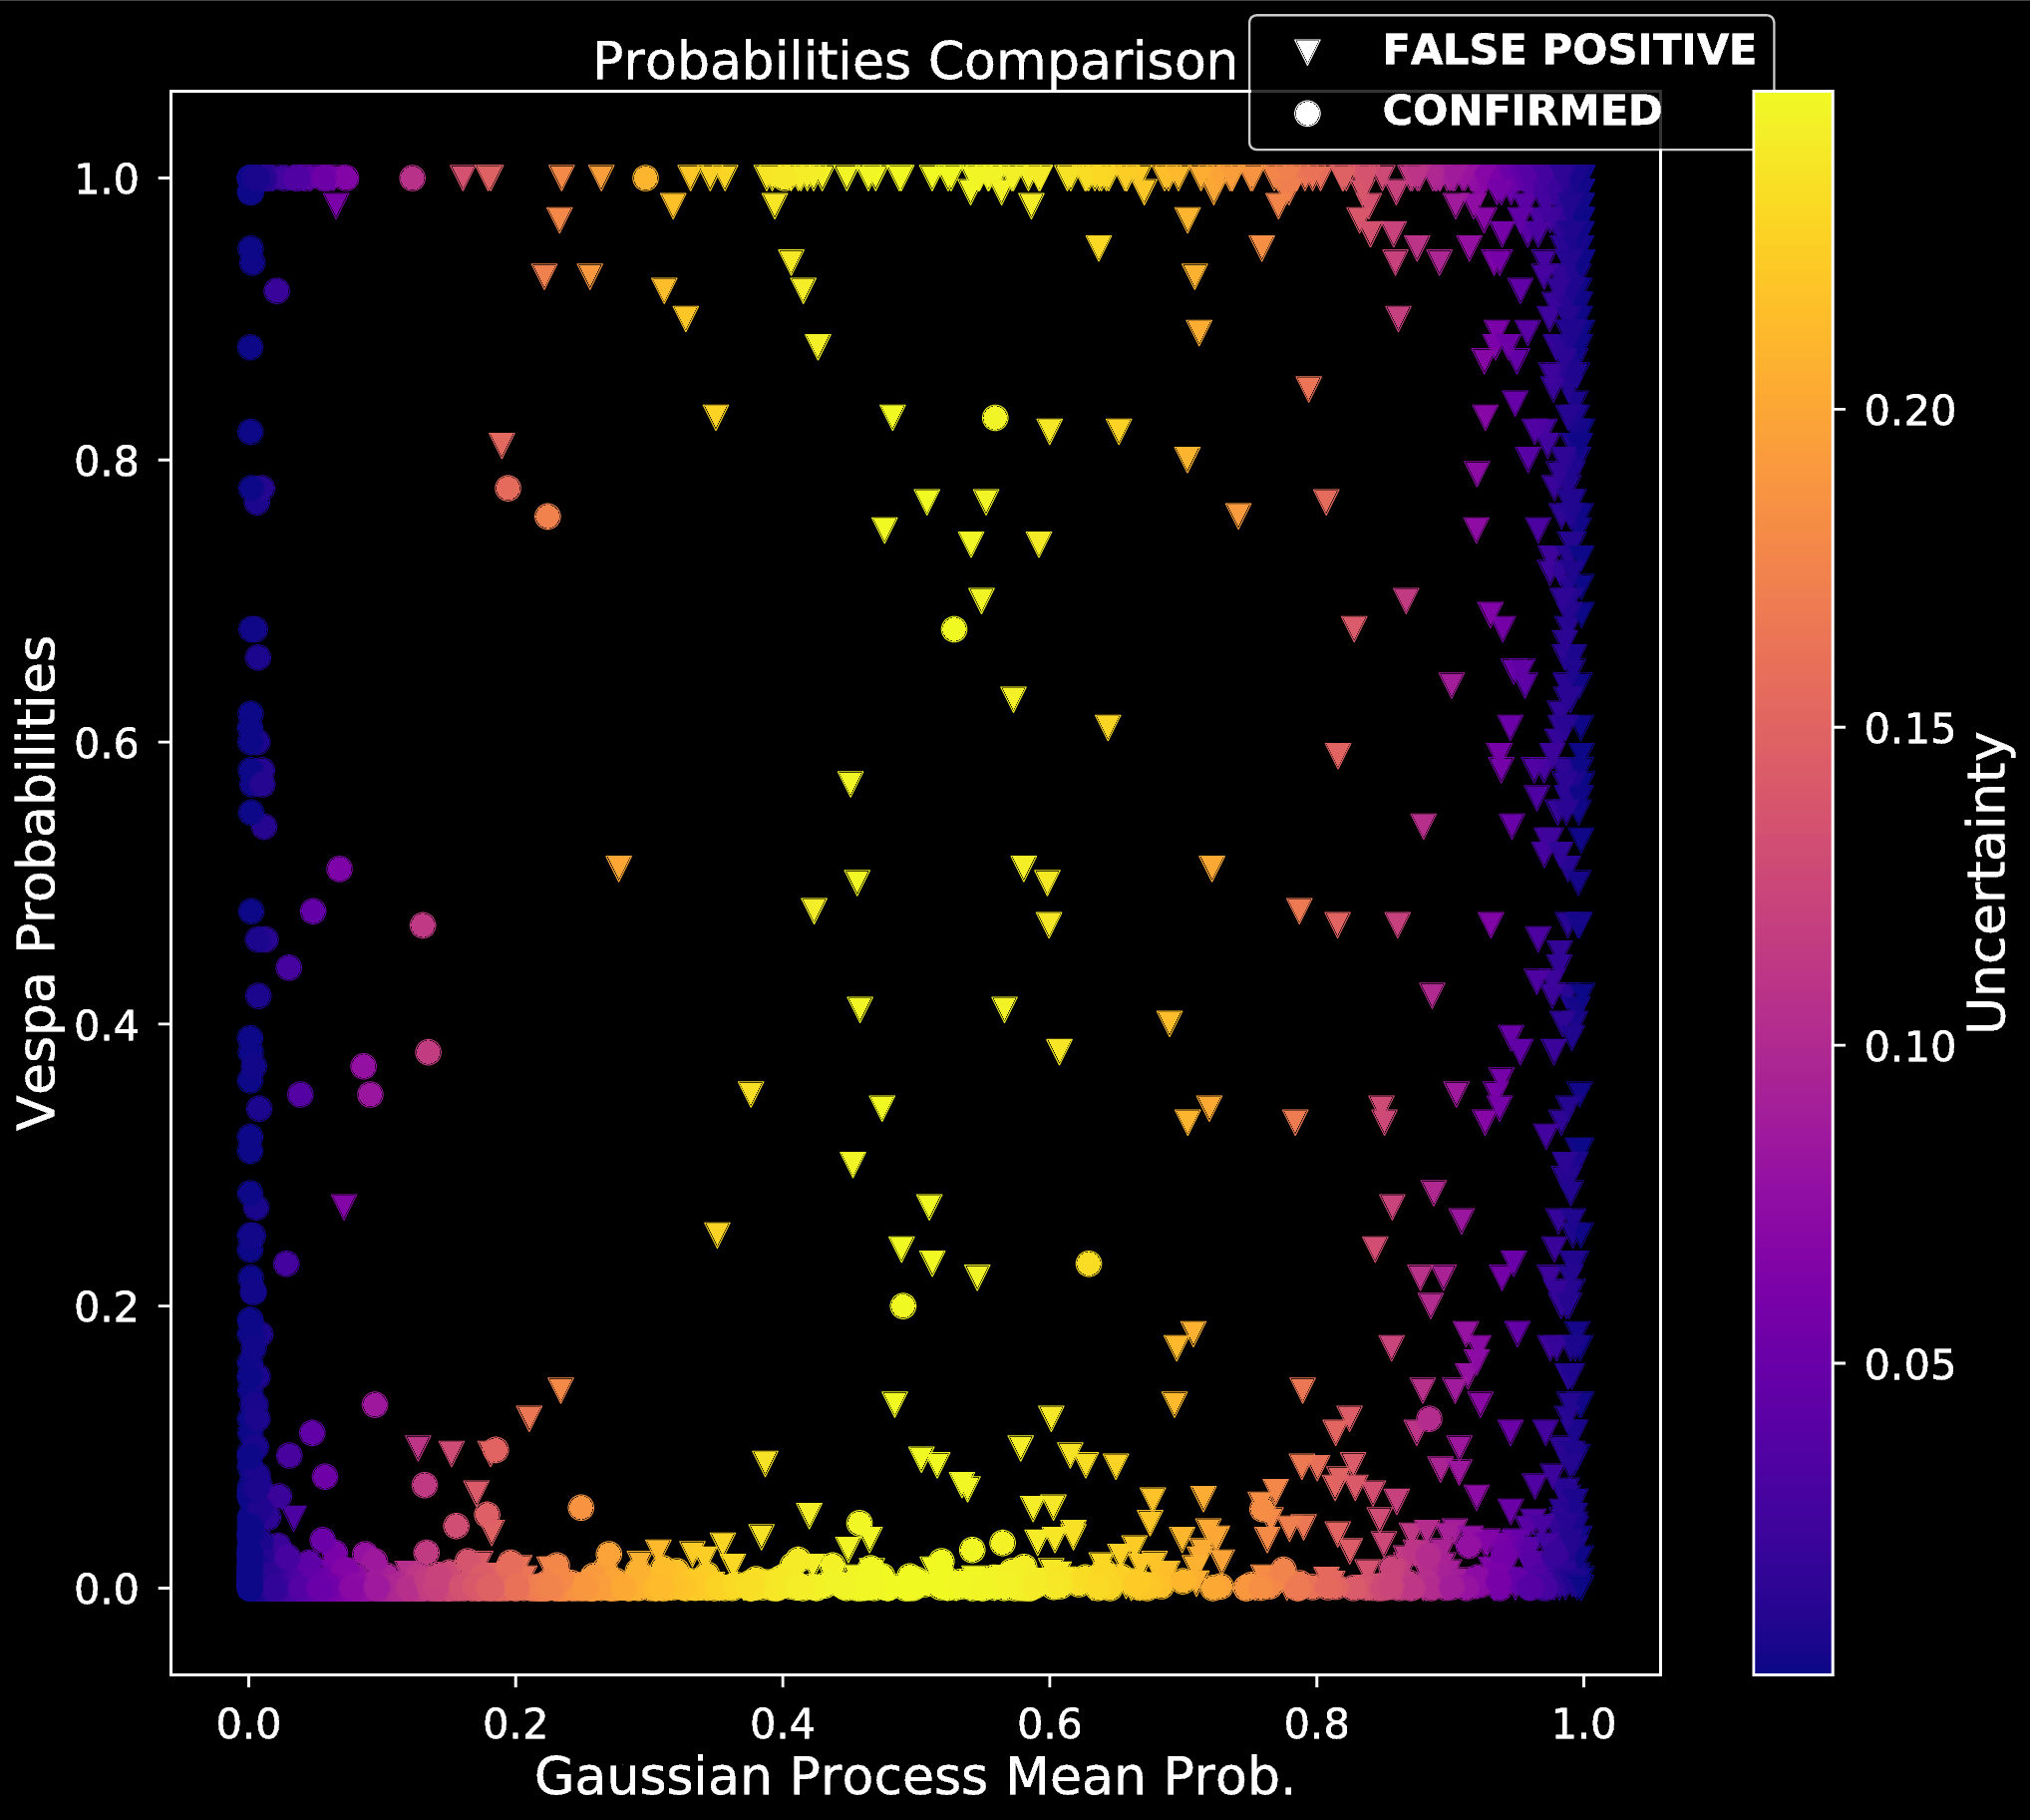
- Compared posterior probabilities to Vespa
- Results:
- Simple decision boundary
- Possibly imbalanced FP scenarios
- High posterior variance for misclassified planets
References:
- Armstrong D.J., Pollaco D., Santerne A., 2016, MNRAS, 465, 2634
- Batalha N. M., 2014, TAJS, 111
- Jenkins J. M., TAJL, 713
- Torres G., et al., 2010, AJ, 727
- Morton T. D., Johnson J. A., 2011, AJ, 738
- Diaz R. F., et al., 2014, MNRAS, 441
- Burke C. J., et al., 2014, AJS, 210
- McCaullif S. D., et al, 2014, AJ, 806
Resources:
- Title Graphics:
bitly link - Mercury transit:
bitly link - Venus transit:
bitly link - Transit anim.:
bitly link